About "Motor Performance Chart"
What is “Motor Performance Chart”?
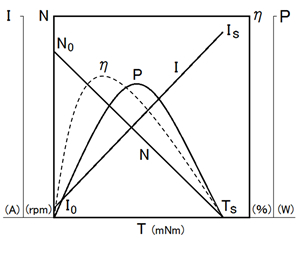
This performance chart is written in the torque reference system. |
|
|
Based on torque T [Nm], Rotation speed : N [r / min] Current : I [A] Output : P [W] Efficiency : η [%] |
 |
| Torque is the moment of force around the axis of rotation and represents the rotational force of the motor. The unit is [Nm]. |
|
How to read “Motor Performance Chart”
Torque - Rotation |
|
|
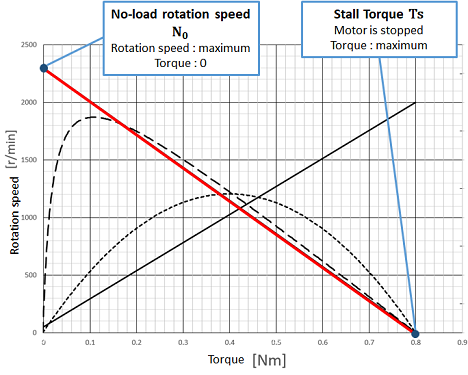
Horizontal axis : Torque [Nm] Vertical axis : Rotation speed [r / min] |
|
|
No-load rotation speed N0 [r/min] Rotation speed when the motor is not loaded |
|
|
Stall torque Ts [Nm] Torque when the load of the motor is increased and the rotation of the motor is stopped |
|
|
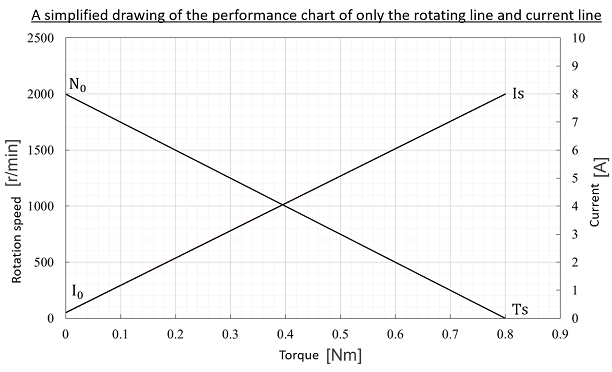
Examples from the right figure N0=2300 [r/min] Ts = 0.8 [Nm] |
|
Torque - Current |
|
|
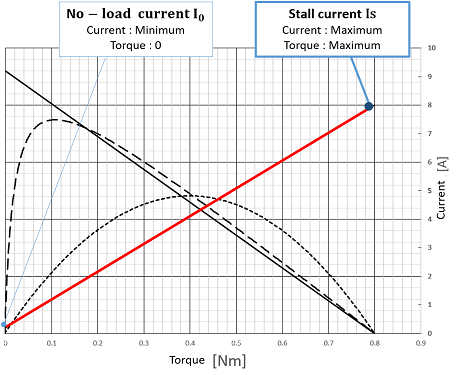
Horizontal axis : Torque [Nm] Vertical axis : Current [A] |
|
|
No-load current I0 [A] Current that flows when a voltage is applied when the motor is not loaded |
|
|
Stall current Is [A] Current when the load of the motor is increased and the rotation of the motor is stopped |
|
|
Examples from the right figure I0 = 0.2 [A] Is = 8.0 [A] |
|
Torque – Output |
|
|
Horizontal axis : Torque [Nm] Vertical axis : Output [W] |
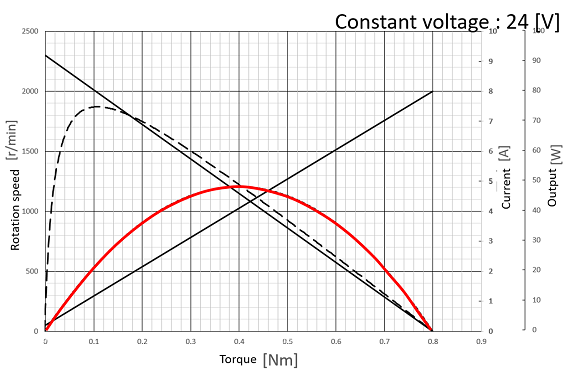 |
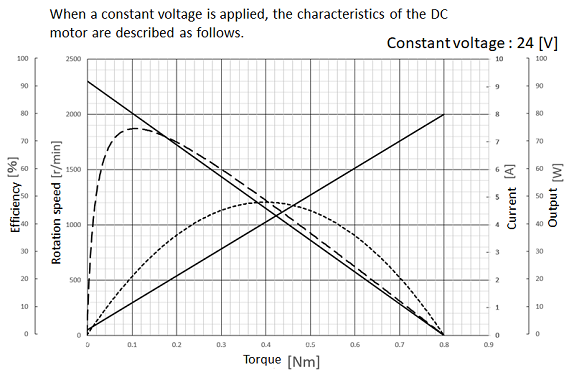
| Output P [W] = N [rad/sec] × T [Nm] = N [r/min] × 2π/60 × T [Nm] The output line can be drawn from the rotation line. |
|
|
Example: Output at 0.1 [Nm] 2000[r/min] × 2π/60 × 0.1[Nm] = 21[W] |
|
The efficiency line |
|
|
Horizontal axis : Torque [Nm] Vertical axis : Efficiency [%] |
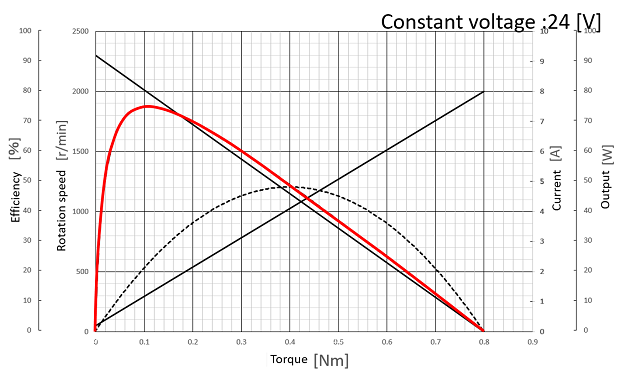 |
| Efficiency η [%] = (P [W])/((V × I) [W]) × 100 The efficiency line can be drawn from the current line and applied voltage. |
|
|
Example : Efficiency at 0.1 [Nm] 21/(24×1.2) ×100 = 73[%] |
|
Changes in each parameter
Changing the following four parameters will affect the performance chart. |
|
|
・Voltage of power-supply Change in voltage applied to the motor |
 |
|
・Number of turns Change in the number of turns of the winding wound around the core |
|
|
・Diameter of winding wire Change in wire diameter of the winding wound around the core |
|
|
・Type of magnet Change in magnetic force |
|
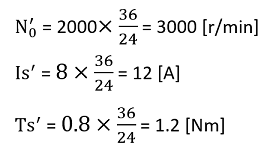
Voltage of power-supplyIf only the voltage of power-supply changes, the performance is proportional to the change of the voltage of power-supply. |
 |
| V :Original voltage V′:Voltage after changed |
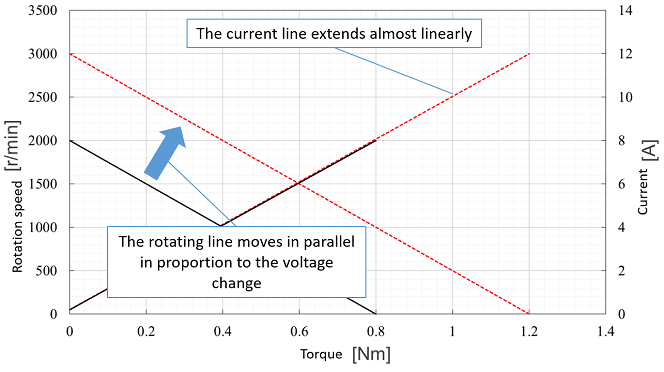 |
| N0′ = N0×V′/V | |
| Is′ = Is×V′/V | |
| Ts′ = Ts×V′/V | |
 |
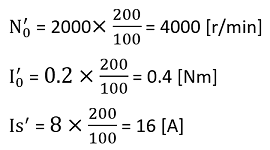
Number of turns
When the number of turns is reduced, the no-load rotation speed and stall current increase proportionally. |
 |
|
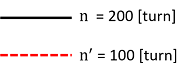
n :original number of turns n′:number of turns after changed |
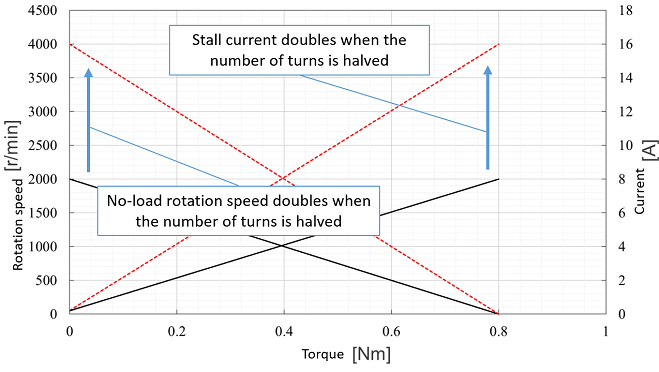 |
| N0′ = N0×n/n′ | |
| I0′= I0 × n/n′ | |
| Is′ = Is×n/n′ | |
| Ts′ = Ts | |
 |
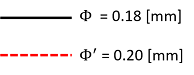
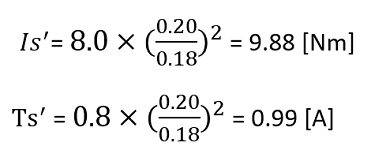
Diameter of winding wireWhen the diameter of winding wire is increased, the stall torque and stall current change in proportion to the square of the diameter of winding wire. |
 |
|
Φ:original diameter of winding wire Φ′: diameter of winding wire after changed |
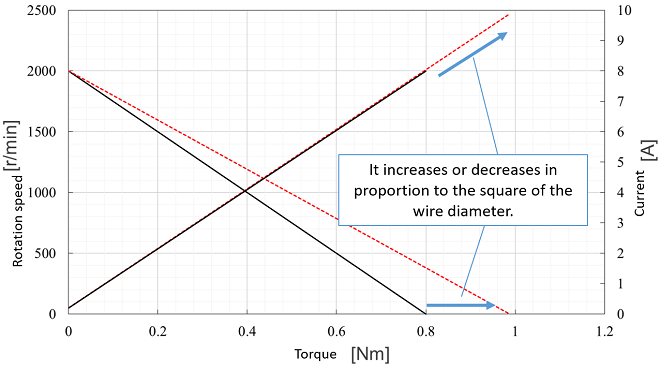 |
| N0′ = N0 | |
| Is′ = Is×( Φ′/Φ )2 | |
| Ts′ = Ts ×( Φ′/Φ )2 | |
 |
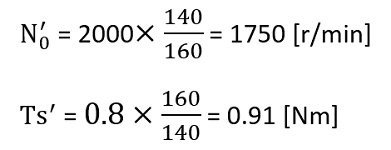
Type of magnetPerformance changes as the strength of the magnetic force changes. The dry type is weaker and the wet type is stronger. |
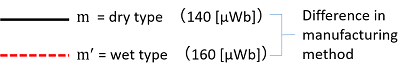 |
| N0′ = N0 × m/m′ | 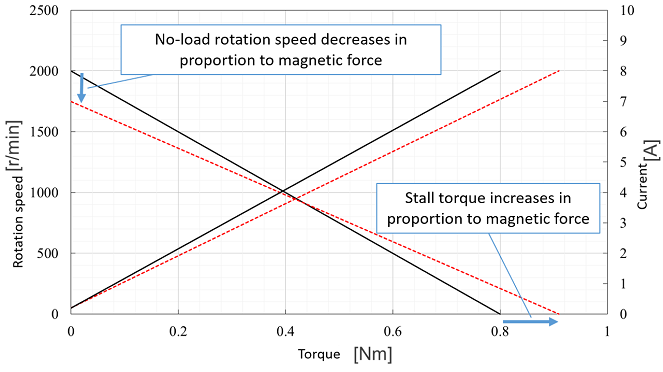 |
| Is′ = Is | |
| Ts′ = Ts × m′/m | |
 |